Which would result in a more stable forecast?
(A) A decrease in the smoothing constant will result in a more stable forecast.
(B) An increase in the smoothing constant will result in a more stable forecast.
(C) Changing the smoothing constant will have no change in the stability of the forecasts.
Answers
Decreasing the smoothing constant in forecasting techniques like exponential smoothing results in a more stable forecast.
In forecasting techniques like exponential smoothing, the smoothing constant (also known as the smoothing factor or alpha) determines the weight given to the most recent observations when making forecasts. A smaller smoothing constant means that less weight is assigned to the most recent data points, resulting in a more stable forecast.
When the smoothing constant is decreased, the forecast becomes less responsive to fluctuations or noise in the data. It puts more emphasis on the long-term trend rather than short-term variations. As a result, the forecasted values tend to change less drastically and exhibit more stability over time.
On the other hand, increasing the smoothing constant would make the forecast more sensitive to recent observations and fluctuations, leading to less stability. Therefore, the correct answer is that a decrease in the smoothing constant will result in a more stable forecast.
In summary, decreasing the smoothing constant in forecasting techniques like exponential smoothing results in a more stable forecast. It reduces the impact of short-term fluctuations and noise in the data, emphasizing the long-term trend and producing more consistent and reliable forecasted values.
Learn more about exponential here:
brainly.com/question/29160729
#SPJ11
Related Questions
Determine the minimum sample size required when you want to be onfident that the sample mean is within one unit of the population mean and 13.8 assume the population is normally distributed.
Answers
The minimum sample size required when you want to be 99% confident that the sample mean is within one unit of the population mean and σ = 13.8 is 1268
Given: To find the minimum sample size, confidence level = 99%, standard deviation = 13.8, and one unit population mean. [Normally distributed]
Solving the given question:
We know that the formula for Margin of error is:
Margin of error = z-score * (standard deviation) / root (sample size)
E = z * σ / √(n), where
E = Margin of error
z = z-score
n = Sample size
σ = standard deviation
Therefore, sample size = ( z – score * standard deviation / margin of error)²
n = ( z * σ / E )²
First, calculate the z-score for the 99% confidence level.
From the normal distribution curve, the area under 99% confidence level is given as:
Area under 99% confidence level = (1 + confidence level) / 2 = (1 + 0.99) / 2 = 0.995
From the z-score table, we find the value of z with the corresponding area of 0.995
We find the value of the z-score corresponding to 0.995 is 2.58
Also given sample mean is one unit of the population. So the margin of error is 1
E = 1
And given Standard deviation = 13.8
σ = 13.8
Putting the values in the given formula of sample size n =
n = (2.58 * 13.8 / 1 )²
n = 1267.64
n = 1268
Hence the minimum sample size required when you want to be 99% confident that the sample mean is within one unit of the population mean and σ = 13.8 is 1268
Know more about “normal distribution” here: https://brainly.com/question/15103234
#SPJ4
Disclaimer: Determine the minimum sample size required when you want to be 99% confident that the sample mean is within one unit of the population mean and G = 13.8. Assume the population is normally distributed. A 99% confidence level requires a sample size of (Round up to the nearest whole number as needed )
a bottle of lemonade normally contains 300 ml. special edition bottles have 10 % extra free. how much lemonade is in the special edition bottles?
Answers
Hence, there is 330 ml of lemonade in the special edition bottles.
The special edition bottles have 10% extra free, which means the total amount of lemonade in the special edition bottle is 100% (normal amount) + 10% (extra amount).
To calculate the amount of lemonade in the special edition bottles, we first need to determine the 10% of the normal amount (300 ml).
10% of 300 ml = (10/100) * 300 ml
= 30 ml
Therefore, the special edition bottles contain an extra 30 ml of lemonade.
To find the total amount of lemonade in the special edition bottles, we add the normal amount (300 ml) to the extra amount (30 ml):
Total amount of lemonade in special edition bottles = 300 ml + 30 ml
= 330 ml
To know more about lemonade,
https://brainly.com/question/20566002
#SPJ11
Check all of the correct name for the object pictured below.
\(\ \textless \ -----P---------------Q\)
PQ>\(PQ--\ \textgreater \ \\\ \textless \ --PQ--\ \textgreater \ \\^-QP^-\\^-PQ^-\\\ \textless \ --QP--\ \textgreater \ \\QP--\ \textgreater \ \)
![Check all of the correct name for the object pictured below.[tex]\ \textless \ -----P---------------Q[/tex]PQ>[tex]PQ--\](https://i5t5.c14.e2-1.dev/h-images-qa/contents/attachments/WDlnicknKYZoJDO483Ndru7zgNHRB7ZD.png)
Answers
C D and F
........................
........................
Answer: F )
Step-by-step explanation:
Because the scale starts at Q and cross through P...
simple as that... :|
Let f(x) = 2x² - 3x and g(x) = 5x - 1.
Find g[f(2)].
g[f(2)] =
Answers
Answer:
Step-by-step explanation:
![Let f(x) = 2x - 3x and g(x) = 5x - 1. Find g[f(2)]. g[f(2)] =](https://i5t5.c14.e2-1.dev/h-images-qa/answers/attachments/Lo55e9uXjNaaQpC1cMKzbxMKNP1qBEAF.png)
To find g[f(2)], we need to evaluate the composite function g[f(2)] by first finding f(2) and then substituting the result into g(x).
Let's start by finding f(2):
f(x) = 2x² - 3x
f(2) = 2(2)² - 3(2)
= 2(4) - 6
= 8 - 6
= 2
Now that we have the value of f(2) as 2, we can substitute it into g(x):
g(x) = 5x - 1
g[f(2)] = g(2)
= 5(2) - 1
= 10 - 1
= 9
Therefore, g[f(2)] is equal to 9.
Learn more about composite function here: brainly.com/question/30660139
#SPJ11
During flu season, there was 156 students out if school on a particular day. if this id 20% if the total number of students at the school, how many total students are enrolled at the school ?
Answers
The problem is about finding the total number of students in a school given a percentage of absences. By using the equation 'whole = part / percent' and substituting the given values, we find that the total number of students in the school is 780.
Explanation:This problem can be classified as a percentage problem in Mathematics. In this scenario, we know that the 156 students represent 20% of the total students. So, in order to find the total number of students, we will use the equation part = percent * whole. In our case, the part is the 156 students, the percent is 20%, and the whole is what we're trying to find.
To solve for the whole, we rearrange the equation to whole = part / percent. Thus, to find the total number of students at the school, we divide 156 by 0.20 (since 20% equals 0.20 in decimal form). When you calculate this, you will get 780. So, the total number of students at the school is 780.
Learn more about Percentage Problem here:https://brainly.com/question/16797504
#SPJ2
HELP ASAP PLEASEEEEE
100 POINTS
An equation is shown: x2 + 4x + 4 = 0
What are the x intercepts? Show your work using a method of your choice.
What is an alternate method you could use to find the x intercepts (other than the method you used)?
What is the vertex? Is it a minimum or maximum? How do you know by looking at the equation?
What steps would you take to graph using the information you have already calculated? How would you use symmetry to help you graph?
Answers
The y-intercept is (0, 4).
An alternate method to find the x-intercepts is to factor the quadratic equation.
The vertex is (-2, 0).
The graph of the equation is illustrated below.
One of the most common types of equations is a quadratic equation, which is an equation of the form ax² + bx + c = 0. In this case, we have the equation x² + 4x + 4 = 0, and we need to find the x-intercepts.
To find the x-intercepts, we can use the quadratic formula, which is given by:
x = (-b ± √(b² - 4ac)) / 2a
where a, b, and c are the coefficients of the quadratic equation. In this case, a = 1, b = 4, and c = 4, so we can substitute these values into the formula:
x = (-4 ± √(4² - 4(1)(4))) / 2(1) x = (-4 ± √(0)) / 2 x = -2
Therefore, the x-intercept is -2. We can check this by plugging in x = -2 into the equation and verifying that it equals zero:
(-2)² + 4(-2) + 4 = 0
In this case, we can see that the equation can be factored as:
(x + 2)² = 0
Taking the square root of both sides, we get:
x + 2 = 0
x = -2
This gives us the same x-intercept as before.
To find the vertex of the parabola represented by the equation, we can use the formula:
x = -b / 2a
and then substitute this value of x into the equation to find the y-coordinate of the vertex. In this case, we have:
x = -4 / 2(1) x = -2
Substituting x = -2 into the equation, we get:
(-2)² + 4(-2) + 4 = 0
Since the coefficient of x² is positive (i.e., a = 1 > 0), the parabola opens upwards and the vertex is a minimum.
To graph the parabola, we can plot the vertex at (-2, 0) and use the x-intercept we found earlier at (-2, 0). Since the equation is symmetric about the vertical line through the vertex, we know that there is another point on the graph that is the same distance from the vertex but on the other side of the line. Therefore, we can plot the point (-3, 0) as well. We can also find the y-intercept by setting x = 0 in the equation:
0² + 4(0) + 4 = 4
Using this information, we can sketch the parabola by connecting the points (-3, 0), (-2, 0), and (0, 4), and noting that the parabola is symmetric about the line x = -2.
To know more about equation here
https://brainly.com/question/10413253
#SPJ1

Im timed! What is the slope of the line represented by the equation f(t)=2t−6?
a
The slope is −6 and the y-intercept is 2.
b
The slope is 2 and the y-intercept is −6.
c
The slope is 2 and the y-intercept is 6.
d
The slope is 6 and the y-intercept is 2.
Answers
Answer:
B
Step-by-step explanation:
Same thing but with t instead of x
Which of the following is a univariate display of quantitative data? histogram mosaic plot bar chart scatterplot
Answers
A histogram is a univariate display of quantitative data that organizes data into bins and shows the frequency of observations within each bin.
A histogram is a graphical representation that displays the distribution of quantitative data. It consists of a series of contiguous bars, where each bar represents a specific range or bin of values, and the height of the bar corresponds to the frequency or count of observations falling within that range.
Histograms are commonly used to visualize the shape, central tendency, and spread of a dataset. By examining the heights of the bars, one can determine the frequency of values within each bin and identify patterns such as peaks or clusters. This makes histograms an effective tool for exploring the distribution and characteristics of a single variable in a dataset.
Learn more about Dataset here: brainly.com/question/24058780
#SPJ11
Lawrence is designing a cooling tank that is a square prism. A pipe in the shape of a smaller 2 ft × 2 ft square prism passes through the center of the tank as shown in the diagram, through which a coolant will flow.
What is the volume of the tank including the cooling pipe?
Do not include units (ft3) in your answer.
Answers
Answer:
63
Step-by-step explanation:
Basically just do the equequation for the volume, witch is 7x3x3 and you get 63
Pls help I have to turn this in tomorrow

Answers
Answer:
10/15 - 3/15= 7/15
Step-by-step explanation:
none
i need help please!1


Answers
Answer:
for the first picture, she cleans 30 windows
the second picture is 52/100 :)
Answer:
It's B for the first one.
For the second one, it is C
Step-by-step explanation:
30 * 0.3 = 9
So 30% of 30 is 9. She did 9 windows.
0.52 = 52/100
It's 52/100 because 0.52 = 52%. 52% then equals 52/100.
52/100 = 13/25
So the answer is 13/25
There are 3 baskets of apples. Each basket has 84 apples. The apples will be divided into 9 equal groups. How many apples will be in each group?
Answers
Answer:
9
Step-by-step explanation:
9x2=18 2groups
18x2=36. 4groups
36x2=72. 8groups
84-72=12. 9groups
The line graph shows the number of cars owned by some families.
b)
a) What is the modal number
of cars owned by the families?
c)
b)
How many families were there?
Number of families
c)
How many cars were there altogether?
0 1 2 3 4
Number of cars
d)
What is the mean number of cars
owned by a family?
Give your answer to 1 decimal place.
Answers
Answer: a). 1
b). 15
c). 26
d). 1.7
The problem uses the in the alr4 package. This data set gives the mean temperature in the fall of each year, defined as September 1 to November 30, and the mean temperature in the following winter, defined as December 1 to the end of February in the following calendar year, in degrees Fahrenheit, for Ft. Collins, CO. These data cover the time period from 1900 to 2010. The question of interest is: Does the average fall temperature predict the average winter temperature? a. Draw a scatterplot of the response versus the predictor, and describe any pattern you might see in the plot. b. Use R to fit the regression of the response on the predictor. Add the fitted line to your graph. Test the slope to be 0 against a two-sided alternative, and summarize your results. c. Compute or obtain the value the variability in winter explained by fall and explain what this means.
Answers
a. The scatterplot of the response versus the predictor shows a positive linear relationship. This means that as the average fall temperature increases, the average winter temperature also tends to increase.
b. The R code to fit the regression of the response on the predictor is as follows:
library(alr4)
data(ftcollinstemp)
model <- lm(winter ~ fall, data=ftcollinstemp)
summary(model)
The output of the summary() function shows that the slope coefficient is positive and statistically significant. This means that the average fall temperature is a significant predictor of the average winter temperature.
c. The value of the variability in winter explained by fall is 0.45. This means that 45% of the variability in winter temperature can be explained by the average fall temperature.
The variability in winter temperature is the amount of variation in winter temperature that is not due to chance. The value of 0.45 means that 45% of this variation can be explained by the average fall temperature. This means that the average fall temperature is a significant predictor of winter temperature.
The positive linear relationship between fall temperature and winter temperature suggests that warmer fall temperatures tend to lead to warmer winter temperatures. This is likely due to the fact that warmer fall temperatures lead to more snow accumulation, which can help to insulate the ground and keep it warm during the winter.
The statistical significance of the slope coefficient means that the relationship between fall temperature and winter temperature is not due to chance. This means that we can be confident that the average fall temperature is a significant predictor of winter temperature.
The value of 0.45 for the variability in winter explained by fall means that 45% of the variation in winter temperature can be explained by the average fall temperature. This means that the average fall temperature is a significant predictor of winter temperature, but there are other factors that also contribute to the variability in winter temperature.
Learn more about scatterplot here:
brainly.com/question/30017616
#SPJ11
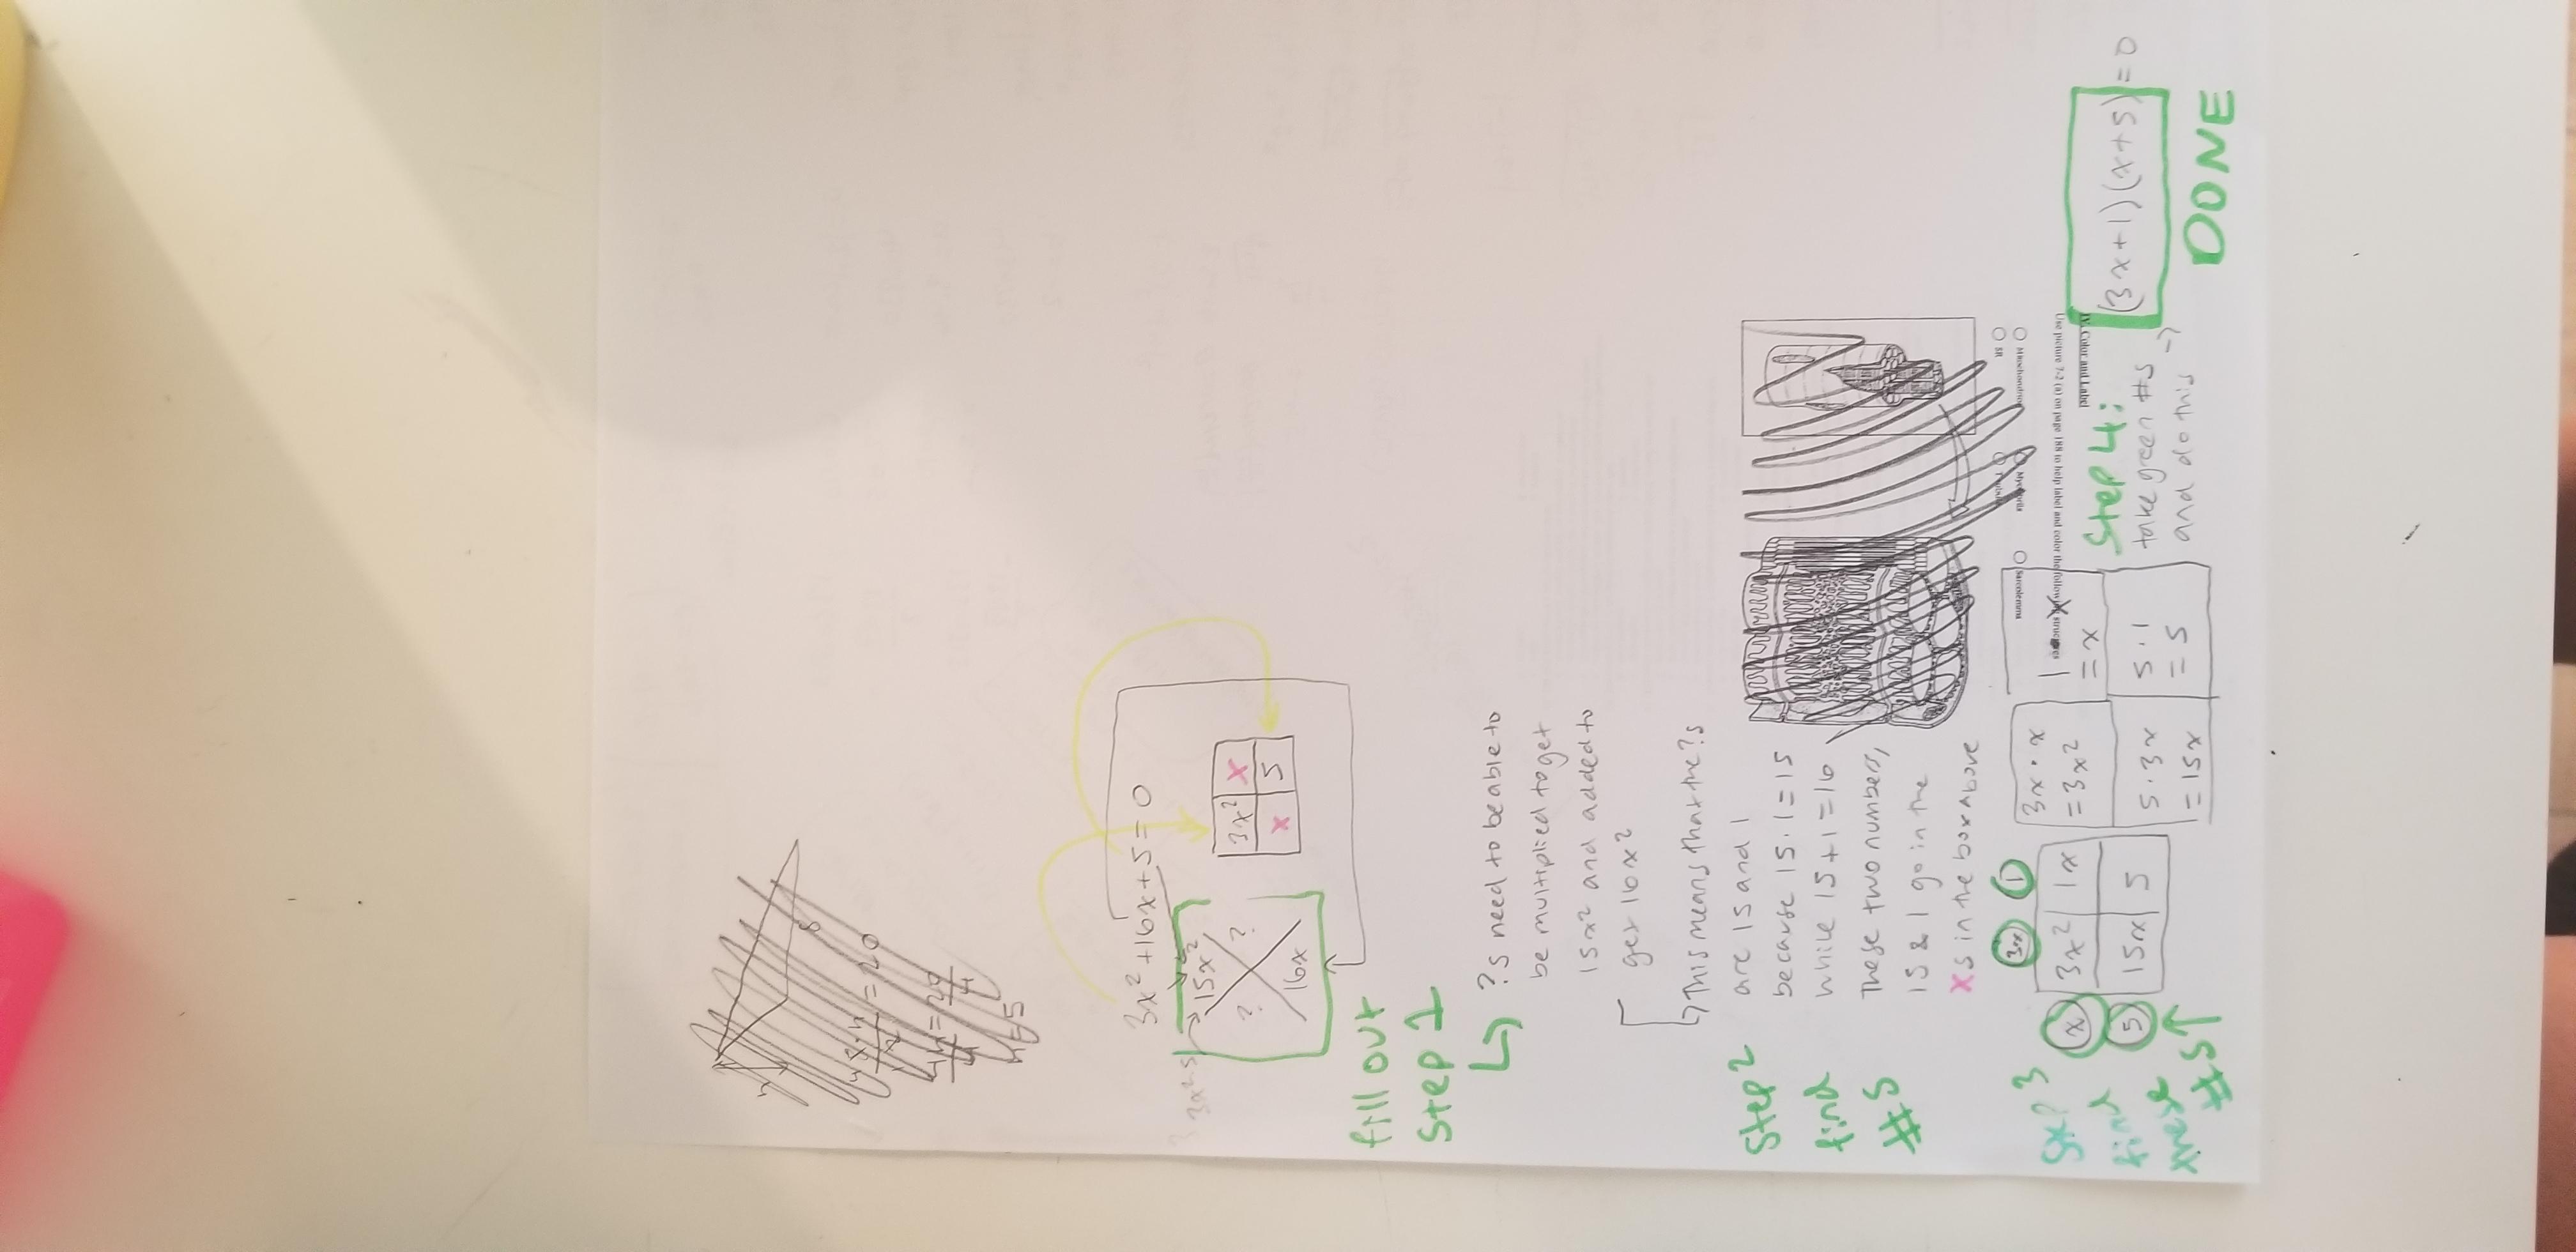
solve: 3x^2+16x+5=0
I did it but apparently its wrong so, please help it would literally probably help me finish high school.
Answers
Answer:
(3x+1)(x+5)
Step-by-step explanation:
Sorry for my handwriting lol hope this makes sense
prove that any graph of minimum degree at least three contains a cycle of even length.
Answers
Answer:
a cycle is a sequence of non-repeated vertices and the degree of a graph is the number of neighbors the vertex has.
PLS HELP ASAP I WILL GIVE BRAINLYEST...
20 Points...

Answers
Answer:
True
True
False
True
Step-by-step explanation:
Given: 9x>-36.
Choose the solution set.
O [xlx>-4)
O'{x1x<-4}
O [xlx>4)
O [xlx<4)
Answers
[x | x > -4)
This can be read as "the set of all x such that x is greater than -4."
Samantha needs to mix a 20% fungicide solution with a 50% fungicide solution to create 100 millileters of a 29% solution. How many millileters of each solution must Samantha use
Answers
The amount of 20% and 50% solution that Samantha needs to mix is 70 milliliters and 30 milliliters respectively.
Let the amount of 20% solution that Samantha needs to mix be x millileters.
Therefore, the amount of 50% solution Samantha needs to mix will be (100 - x) millileters.
According to the question, Samantha needs to create 100 millileters of a 29% solution.
The expression below can be used to calculate the volume of the mixture obtained after mixing x milliliters of the 20% solution and (100 - x) milliliters of the 50% solution:
0.20x + 0.50(100 - x) = 0.29(100)
Simplifying and solving for x:
0.20x + 50 - 0.50x = 29
x = (29 - 50) / (-0.30)
x = 70 milliliters
Therefore, the amount of 20% solution that Samantha needs to mix is 70 milliliters.
And, the amount of 50% solution that Samantha needs to mix is 30 milliliters.
Learn more about chemical solution at:
https://brainly.com/question/17554892
#SPJ11
a decision variable is an algebraic variable that represents a quantifiable decision to be made
T/F
Answers
Answer:
f
Step-by-step explanation:
Write a formula that expresses the radius of the circle, r (in cm), in terms of the number of seconds, t , since the circle started shrinking.
Answers
The formula expressing the radius of the circle, r (in cm), in terms of the number of seconds, t, since the circle started shrinking is r = r₀ - kt, where r₀ is the initial radius and k is the rate at which the circle is shrinking.
The formula r = r₀ - kt represents the relationship between the radius of the circle and the time elapsed since it started shrinking. Here's an explanation of the variables:
r represents the radius of the circle at any given time t.r₀ represents the initial radius of the circle when it started shrinking .k represents the rate at which the circle is shrinking, indicating how much the radius decreases per unit of time.t represents the number of seconds that have elapsed since the circle started shrinking.
By subtracting kt from the initial radius r₀, we can determine the current radius of the circle at any given time t. The term kt represents the amount by which the radius decreases over time, based on the rate of shrinkage defined by the value of k.
To learn more about expressing.
Click here:brainly.com/question/1859113
#SPJ11
A car travels at an average speed of 48 miles per hour. How long does it take to travel 252 miles? hours minutes 5 ?
Answers
So, it would take approximately 5 hours and 15 minutes to travel 252 miles at an average speed of 48 miles per hour.
To find the time it takes to travel a certain distance, we can use the formula:
Time = Distance / Speed
In this case, the distance is given as 252 miles and the average speed is 48 miles per hour. Plugging these values into the formula, we get:
Time = 252 miles / 48 miles per hour
Simplifying the expression, we find:
Time = 5.25 hours
To know more about average speed,
https://brainly.com/question/6096589
#SPJ11
PLEASE HELL AND CHECK OUT

Answers
Answer:
so every 6 cups there you can make 96 cookies
Step-by-step explanation:
The exact volume of a cylinder with radius 3 cm and height 6 cm is:
Answers
The table below shows the cost of X pounds of bananas. What is the cost for 1 pound of bananas?

Answers
Here, we want to get the cost for one pound of banana
To do this, all we have to do is to divide the cost by the number of pounds
We can infact select any of the pairs
We have the cost as;
\(undefined\)X/8 = 13/20 what is x
Answers
Answer:
X/ 8 = 13 /20
X × 20 = 13 × 8
X = 104/20
X = 5.2
Answer:
\(\huge\boxed{\sf x = 5.2}\)
Step-by-step explanation:
\(\sf \frac{x}{8} = \frac{13}{20} \\\\Cross-Multiplying \\\\x * 20 = 8*13\\\\20x = 104\\\\Divide\ both\ sides\ by\ 20\\\\x = 104 / 20\\\\x = 5.2\\\\\rule[225]{225}{2}\)
Hope this helped!
~AH1807Will give crown will post more

Answers
Answer:
2, 7, 27, 42
Step-by-step explanation:
y = 5*1 -3 =2
y = 5*2 -3 =7
y = 5*6 -3 = 27
y = 5*9 -3 = 42
Answer:
See below
Step-by-step explanation:
\(y = 5x - 3 \\ \\ \begin{vmatrix}x &\: \: \: y \\ \\ 1&\: \: \: \boxed{\red {\bold 2} } \\ \\ 2&\: \: \: \boxed{\purple {\bold 7} }\\ \\ 6&\: \: \: \boxed{ \orange {\bold {27} } } \\ \\ 9&\: \: \: \boxed{\pink{\bold {42} } } \end{vmatrix}\)
D. Robertas boat was farther from the dock at the beginning, and it traveled more quickly
I'll give u 5 stars if you right

Answers
Answer:
C
Step-by-step explanation:
John:
y = x +30
y = 5x + 50
Roberta:
y = 5x + 2
Conclusion:
You can see that John's boat was farther from the start and traveled faster because when John traveled for 5 hours, he traveled 50 miles while Roberta only traveled 25 miles for the same time.
Hello There!
Your correct answer is C.
There is no way to explain but when I put A it is incorrect but when I read that it was wrong I wanted to let other people that it was incorrect. Thanks!
Hope this helps to all you ape.x learners!!
(Tuesday, March 2/2021)
a church has 7 bells in its bell tower. before each church service 3 bells are rung in sequence. no bell is rung more than once. how many sequences are there?
Answers
There are 210 sequences for 7 church bells to rung with the given conditions. Using permutations, the required number of sequences is calculated.
What are permutations?A sequence or arrangement that can be framed by taking some or all of a finite set of things (or objects) is called a permutation.
The formula for finding the number of such arrangements is,
ⁿPₓ = n!/(n - x)!
Calculation:It is given that, a church's bell tower has 7 bells. 3 of them will ring in a sequence before each service and no bell is rung more than once.
So, the number of sequences that the bells will form is calculated by using the permutations formula. I.e., ⁿPₓ = n!/(n - x)!
Here, n = 7; x = 3
Then,
ⁿPₓ = n!/(n - x)! ⇒ ⁷P₃ = 7!/(7 - 3)! = 7!/4!
⇒ ⁷P₃ = (7 × 6 × 5 × 4!)/4! = 7 × 6 × 5 = 210
Therefore, there are 210 sequences for ringing the bells.
Learn more about permutations here:
https://brainly.com/question/1216161
#SPJ4
Your current test average in Science is an 81. You've taken 5 tests. You only have one test remaining. What grade would you need on the
next test to raise your average to an 85?
Answers
Answer:
You must get a 89%
Step-by-step explanation:
81+89=170
170/2= 85%